Posts Tagged ‘national debt’
Newsletter #2, 2011: Last week was brutal, but what can we expect going forward?
2 CommentsSunday • August 7, 2011 • by ewmoe
The S&P 500 was down 7.2 % last week, which was the largest selloff in 32 months! This selloff has in a little over a week wiped out USD 2.0 trillion, almost the same amount as the combined size of QE1 and QE 2. This just shows how fast asset values can deteriorate in a stock market downtrend. In other words this was a big event.
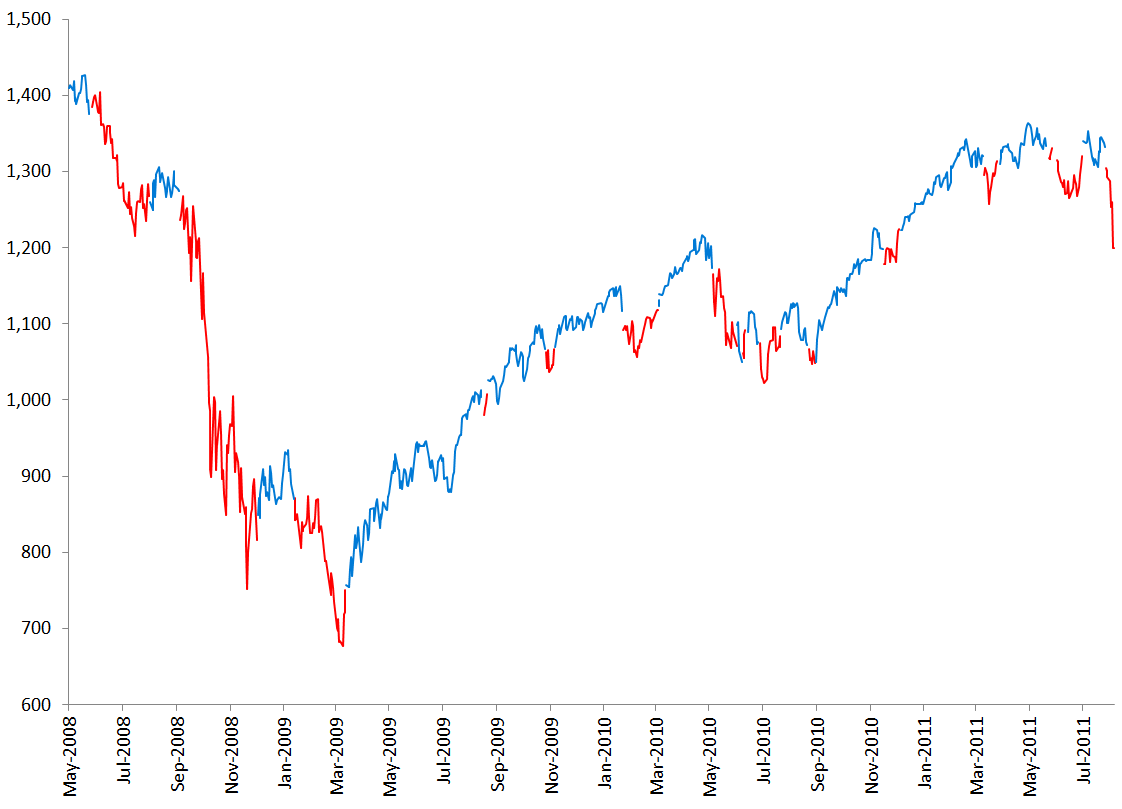
I have not sent out a newsletter for many months now, the last one was on March 25th, but I feel that the performance of the market over the last few weeks calls for another one now. Before I get into what I will discuss today I want to remind you to pay close attention to the model I use to calculate the turning points in the market. The model does not perform that well in a choppy market like we have had for most of this year, but in a longer time frame, as the chart below indicates, it has performed pretty OK.
Performance of the model since its inception in May 2008. The line is BLUE those days that the model indicates that we are in an UPTREND and RED those days that it indicates that we are in a DOWNTREND.
I am covering the following topics in today’s newsletter:
- The implications of the US credit downgrade and why the US should attack Switzerland
- Still no sign of leadership from Washington
- Official numbers say that unemployment is falling, but does that really matter?
- Is this market correction the start of another bear market?
Archives
- December 2021 (1)
- August 2020 (1)
- March 2020 (2)
- October 2018 (1)
- March 2018 (3)
- February 2018 (1)
- July 2016 (1)
- June 2016 (2)
- January 2016 (1)
- December 2015 (2)
- September 2015 (1)
- August 2015 (1)
- February 2015 (1)
- December 2014 (1)
- November 2014 (1)
- October 2014 (1)
- August 2014 (2)
- May 2014 (1)
- March 2014 (1)
- February 2014 (1)
- January 2014 (1)
- October 2013 (2)
- September 2013 (1)
- August 2013 (1)
- July 2013 (1)
- June 2013 (3)
- April 2013 (2)
- March 2013 (1)
- February 2013 (1)
- December 2012 (1)
- October 2012 (1)
- July 2012 (1)
- June 2012 (2)
- May 2012 (1)
- April 2012 (2)
- December 2011 (1)
- November 2011 (1)
- October 2011 (1)
- September 2011 (1)
- August 2011 (2)
- July 2011 (2)
- June 2011 (4)
- May 2011 (1)
- March 2011 (3)
- December 2010 (1)
- November 2010 (1)
- September 2010 (1)
- August 2010 (1)

