
Posts Tagged ‘RJA’
Market in UPTREND, July 5th
Friday July 1st was a 90% panic buying up day, indicating that more investors are entering the market. The S&P500 was testing resistance off the 200DMA between June 15th and June 26th and has been moving upward since then. The upward move has not been as strong as I would prefer to see it (going up in below average volume), but it has crossed through the 50DMA and stayed above this line. The major indexes are now 6-8% off the recent lows. All in all the market action has turned my model into UPTREND which historically has significantly proven to redue risk when buying stocks.
The stock market has been really choppy this year, which research shows is very typical for third year bull markets. There’s no guarantee the choppiness won’t continue. What usually happens in the market is that we have seasonal strength in January, then weakness in February, strength in March-April, and weakness in May-June and then again a summer rally in July until early August. We can hope that the choppiness lessens and that we will get a healthy market over the summer. But no one has ever made money over time by relying on hope. Time will tell if this will be a typical summer, but the market will clear signals as to wether it holds up or not. Until the next market update is out (indicating a new downtrend), things to look for includes the next levels of major resistance which sits at 1,350.
Looking to other asset classes for indication for how the stock market will do in this uptrend and over the next summer months can also give a good indication for what we have in store. It is unfortunately not pleasant reading. See chart below of the RJA (Elements Rogers Intl Commodity Index).
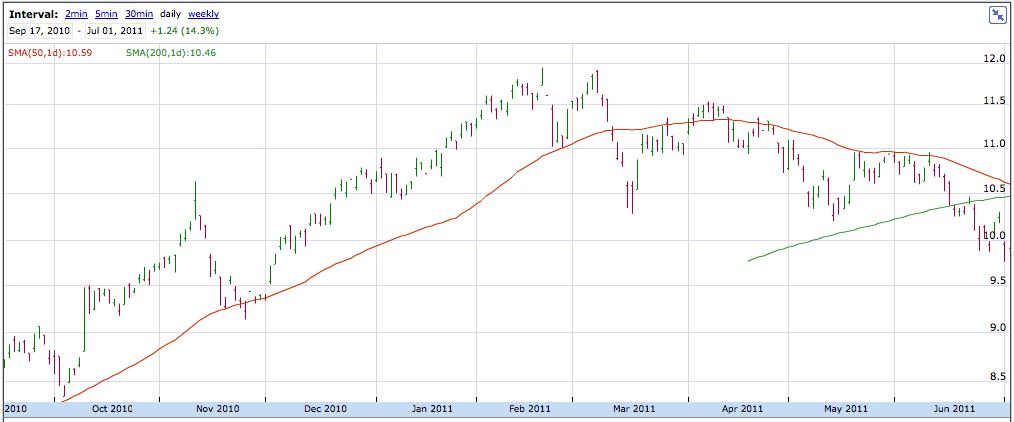
Source: Google Finance
Agricultural commodities have been leading the stock market by several months during QE1 and QE2. They peaked in February 2011, well ahead of the stock market’s May 2nd peak. Since that February peak they have crossed below the 50DMA and met resistance to this line from the downside several times before eventually also breaking down through the 200DMA on June 22nd. They are now well below the 200DMA and in addition the 50DMA is very close to crossing the 200DMA. That would be another negative if it were to happen.
The picture for several other commodities including oil looks equally bad. As I have written many times before, which still holds true: gold is the only market with no major breakdown since the start of the financial crisis. Gold is still the go-to-market for financial safety.
I remain cautious and keep looking for signs of further strength and weakness both in the stock market itself and in other markets attracting capital, despite the fact that we are in an uptrending market.