Posts Tagged ‘European debt crisis’
Market in DOWNTREND – November 21st
All eyes are on Europe these days, and for good reason. A spike in bond yields in Spain and Italy Thursday last week continued to fuel contagion worries. In addition bonds in central European countries like France, Belgium, Finland and Austria got unloaded, indicating that investors are starting to discount systemic risk in all EU countries not just the PIIGS. How anyone can believe that the current debt levels and valuations can be sustained continues to amaze me. Market action since early August shows that investors as well are getting increasingly uncertain about the sustainability of our current financial and economic model. To me the main uncertainty when it comes to Europe right now is not if, but when: How long can they keep the illusion alive and which country will leave the Euro first. When the illusion falters, the stock markets will enter a massive crash.
The market has been exceptionally choppy all year and the choppiness increased several-fold after the early August crash, which still holds as the date for the start of a new bear market. The October 27th start of a new uptrend was nothing but a start of a new uptrend, it was rather an indication of an intermediate market top. Not getting follow-through on trend change signals is a sign of a weak market. Since then the market has been just that; with strong selling pressure. NYSE down volume was 93% of total volume last Thursday. Losers led winners by a nearly 9-to-2 ratio on the NYSE and by a 5-to-2 ratio on the Nasdaq. Both indexes failed at breaking above their 200 day moving averages (DMA) and have now fallen below the 50 DMA. The Nasdaq and S&P 500 have fallen below support at 2,600 and 1,220 respectively. In addition the S&P has made five lower highs since its 10/27 top. Top names like Apple and Amazon have also experienced heavy institutional selling—an indication of risk aversion. All contributing to shifting the model to a DOWNTREND. Note that after such intense days of selling it is not unlikely that the market can bounce back for a few days. The next downside support levels for the S&P 500 are at 1,175 and 1,125.
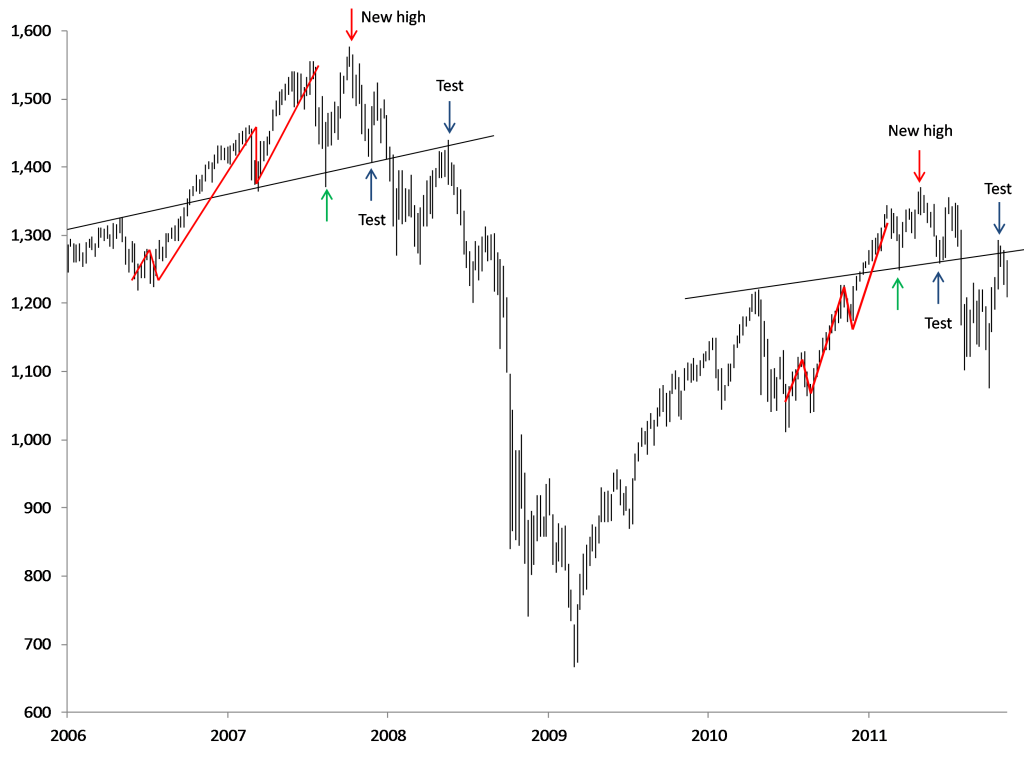
I presented the chart below the first time in the August 7th, 2011 Newsletter. And so far the similarity of the index’s path is striking.
S&P 500 weekly high-low bars
Usually interesting chart patterns like this one does not track for long, but this has now tracked since first half 2010. If it continues to do as well as it has done for about 18 months now, it does not bode well for stock markets going forward and the start of next year will be absolutely devastating. My sincere recommendation since summer to exit your stock portfolios is not at all based on this chart, but I must admit that it is starting to show strong support.
More importantly for that view is that Europe and the US are facing their biggest financial challenges in history now. Much greater than those that led to the financial crisis of 2008, and they are quickly running out of ammunition to deal with it. Ammunition or not, I believe that the situation will not be corrected before we see much more financial suffering in the form of very high inflation or a massive debt deflation. Both will lead to massive inflation adjusted stock market crashes.
China is still a country that many believe will continue to be untouched of the problems in Europe and the US. I however believe that China will see much larger problems than the West; largely due to their own structural challenges. It is getting increasingly difficult for small and medium sized businesses to get credit at banks. Official price inflation is 5.5%, which means that actual price inflation is likely a few percentage points higher and individual savings rates are at 3.5%. This means that Chinese, who have very high savings rates, are seeing their wealth being eroded by inflation. Chinese savers have tried to avoid inflation by investing in real estate which I believe have created a real estate bubble, that could pop at any moment. With only 35% of GDP coming from consumption (compared to 70% in the US) the Chinese economy is still extremely dependent on exports to Europe and the US, which is likely to fall back significantly when eventually the European and US economy starts to slow.
A falling Chinese economy will contribute to ensuring that there is no safety to be found by investing in commodities. Commodity prices as well as silver and gold will together with stocks go down in the coming market crisis. Gold is still the “last man standing.” But remember that gold took its largest hit not in bull years, but in the crash year of 2008. I have earlier suggested that you buy a little gold each month; between 5 and 10% of your net savings depending on how much “insurance” you feel you need. Despite expecting the gold price to fall I continue to suggest that you buy some physical gold each month. Falling prices will just mean that your “insurance policy” will get cheaper. Hopefully you will never have to sell or use that gold you are buying.
In an environment with falling stocks, commodities, precious metals, and most other major asset classes, the one thing going up will be the USD.

