
Posts Tagged ‘bear market’
Market in DOWNTREND, September 4th
The model switched back to downtrend last Friday September 2nd. For those of you who are new to this model, that means that you do not want to own or buy shares. The odds are stacked against the bulls right now and chances are much higher that you will make money shorting the market. Since the crash in August, all signals seem to indicate that the bull market that we have been in since March 2009 has ended, and that we are entering another bear market. That again means that you should be doubly cautious owning stocks.
The jobs report that came in on Friday added zero jobs, a negative since we need at least 125,000 jobs a month just to keep up with population growth. Over the last three months the official numbers have furthermore been revised down 58,000. The national manufacturing activity report from the Institute of Supply Management (ISM) came out Thursday at 50.6, which is just a tad above a contraction. This was the third straight month in which inventories rose more than new orders.
The business outlook survey (BOS) from the Philadelphia Fed does not look much better (chart below). The survey’s broadest measure of manufacturing conditions, the diffusion index of current activity, decreased from a slightly positive reading of 3.2 in July to -30.7 in August. The index is now at its lowest level since March 2009.

The last two times the index reached -20 or lower, in January 2001 and August 2008, the stock market responded with crashes. In 2001 the market corrected 41% until its bottom on October 10th, 2002. After the second low reading in August 2008 the market fell 45% until its low in March 2009. You should off course not base your investment decisions on just a few observations, but the ISM and the BOS are both very good starting points. Take also another look at the other data points from my previous post which also indicate that we are heading towards a new economic recession.
Based on my reading of the market at this juncture; the risk reward in stocks is not favoring long-term holders. For those of you with a 401(k) or any other savings in the stock market for that matter, you should strongly consider exiting those investments now and moving into cash. Cash, you might say, offers no yield, why would you want to invest in that? I think we are heading into an era when you will be happy by loosing as little as possible and were everything will be about relative returns. If the stock market falls 50% and you have kept your savings in cash, your purchasing power in terms of stocks has just doubled! Same goes with any other asset class that deflates relative to cash. I believe that the purchasing power of your cash will increase relative to almost all asset classes over the coming years, if this is in fact, which it seems to be, the start of a new bear market.
Market timing is extremely difficult. Hitting the exact top or bottom is for all practical purposes impossible, but still many investors are extremely hesitant to exit their positions if their portfolio is lower than it was at the top. Here is a story that can illustrate this behavior (the story is from William O’Neil’s excellent book How to Make Money in Stocks):
“A little boy was walking down the road when he came upon an old man trying to catch wild turkeys. The man had a turkey trap, a crude device consisting of a big box with the door hinged at the top. This door was kept open by a prop to which was tied a piece of twine leading back a hundred feet or more to the operator. A thin trail of corn scattered along a path lured turkeys to the box. Once inside, the turkeys found an even more plentiful supply of corn. When enough turkeys had wandered inside the box, the old man would jerk away the prop and let the door fall shut. Having once shut the door, he couldn’t open it again without going up to the box and this would scare away any turkeys lurking outside. The time to pull away the prop was when as many turkeys were inside as one could reasonably expect. One day he had a dozen turkeys in his box. Then one sauntered out, leaving 11. “Gosh, I wish I had pulled the string when all 12 were there,” said the old man. “I’ll wait a minute and maybe the other one will go back.” While he waited for the twelfth turkey to return, two more walked out on him. “I should have been satisfied with 11,” the trapper said. “Just as soon as I get one more back, I’ll pull the string.” Three more walked out, and still the man waited. Having once had 12 turkeys, he disliked going home with less than eight. He couldn’t give up the idea that some of the original turkeys would return. When finally only one turkey was left in the trap, he said, “I’ll wait until he walks out or another goes in, and then I’ll quit.” The solitary turkey went to join the others, and the man returned empty-handed. The psychology of the normal investor is not much different. They hope more turkeys will return to the box when they should fear that all will walk out and they’ll be left with nothing.”
This is the type of stock market that we have likely entered into. It is a big likelihood that those of you waiting to get 12 or 13 turkeys now will have to wait for a decade or longer and in the meantime see your portfolios halve or worse (this off course could change if the Fed decides to print a few more trillion USDs). So how should you exit your investments? I would say for most people the best thing is to just get out and be over with it. But if you are not following my model and feel some resemblance to the old turkey hunter in the way that you would be unwary if the stock market was to recover towards the end of the year, I would recommend that you exit your portfolio over time. One way to do this would be to exit your portfolio in equal portions over a fixed time period. Let’s say that you decide to start exiting this week and want to be fully out by the end of the year. There are 17 weeks left of the year, which means that you would exit your portfolio in 17 equal portions until the last week of the year. Assuming that you have a total of 10,000 shares/units, it could for example mean that you would sell 590 shares once a week the next 16 weeks and then 560 shares the last week of December. The length of your period should be whatever you are comfortable with and depending on how long you think a potential bear market rally will last. If you think that this is just another correction in the bull market from March 2009, then you should sit tight and wait for another uptrend signal.
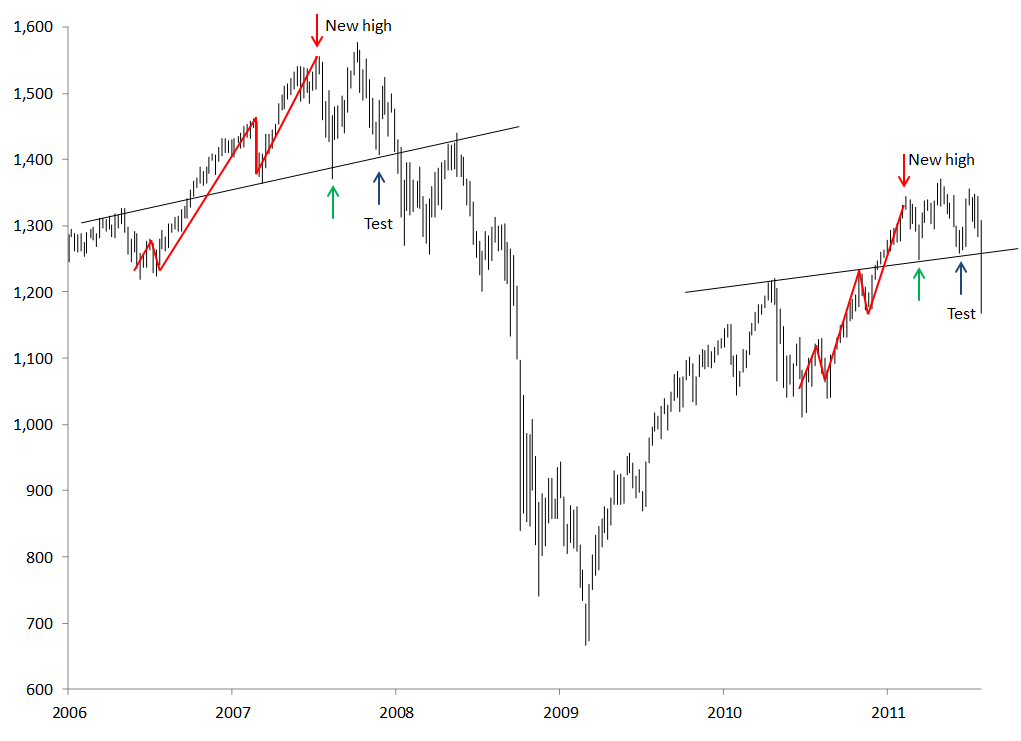
Below is an updated version of the chart that I posted in the newsletter from August 7th.
S&P 500 weekly high-low bars

The last uptrend was not able to push the index upwards to the resistance level. I will continue to update this chart regularly going forward. I would not be surprised to see this downtrend or the next one push the indexes below the August lows. Markets typically correct between 40-60% in bear market rallies so if we see a new low in September it would be normal to see such a rally last maybe towards the end of the year. Remember that this is rough estimates based on how the markets look today. It could change on very short notice. You will be much better off by following the signals of the model than to try to guestimate what the markets might or might not do in the future.
You will find the performance of the model by following the link here.
Market in UPTREND, August 24th
Yesterday’s strong market action turned the model around and we are therefore as of today in a new uptrend.
The correction we have seen in the market over the last few weeks has the third-steepest descent since at least 1970, only Black Monday in 1987 and the October 2008 were worse. Only time will show if this was a correction like in 1987 or if we are heading into another bear like the most recent between October 2007 and March 2009.
There are several indications that point to this being the start of another bear market:
- The Philadelphia Fed State Coincident Index is dropping like a stone. From 90 in April down to 32 in the latest report. Every single time the indicator has fallen like this over the last 30 years we have gone into a recession. So it has correctly “anticipated” five of the last five recessions.
- The consumer confidence is at 54.9. This is lower than anytime during the Financial Crisis, and the lowest it has been since May 1980.
- Strong volume on a sell-off and weakening volume on a rebound make for the opposite of what bulls want to see.
- S&P 500 is down more than 20% measuring intraday low vs. high over the last few months.
- The 200DMA is sloping downwards.
- The 50DMA has crossed below the 200DMA.
- The bigger problem in today’s economy are credit related and currently the bank index, DKX, is leading the market lower.
If this correction turns out to be the start of a bear market, then the recent action is historically typical. In the past four bear markets, the first aggressive swing down was followed by a rebound. The indexes erased anywhere from 20% to 58% of the initial loss before they made a fresh move down.
We might be in one of those rebounds now, so be careful not to jump straight bank into the market even if the model has turned to an uptrend. In a bear market the upturn signals does not as often as in bull markets, which we have had since March 2009, lead to sustained uptrends.
I believe that markets could be waiting for what Benny B has up his sleeves and hoping that his speech on Friday could reveal something positive for the stock market. If the Fed decides to launch a third round of quantitative easing it could be the fuel that will drive stock markets higher.
If you decide to enter the market now, look for those stocks that bounce the most in the shortest amount of time, these are most likely the ones that are going to be the leaders of the new advance. And pyramid into your positions. This is a high risk market to be invested in.
Follow this link if you would like to see the performance of the model.
I just recently posted the latest newsletter that can be found here. I would specifically recommend that you take a look at the following chart and follow how the indexes behave when they reach their respective resistance lines.